


Your factory runs. Your electricity bill arrives. Somewhere between those two facts, a very large number appears, and almost nobody in the building can explain exactly how it got there.
That gap is what energy monitoring closes. In simple terms, energy monitoring means measuring how much electricity your plant uses, where it goes, and when it is used, continuously rather than once a month. An energy monitoring system is the hardware and software that does the measuring for you.
This guide assumes you have just heard the term and want to understand it properly. So we will start with the definition, walk through how industrial energy monitoring actually works, and then spend real time on the part most factory managers care about first: decoding your own electricity bill. By the end, kW, kWh, kVA, power factor, and demand charges will stop being jargon and start being levers.
No sales pitch. Just the concepts, in order.
What Is Energy Monitoring? The Short Answer
Energy monitoring is the continuous measurement and recording of electricity use, broken down by time and by location inside your facility.
That is the whole definition. But the two qualifiers do the heavy lifting.
Continuous matters because a monthly bill is a single number describing 720 hours of activity. It tells you that you spent money. It cannot tell you which shift, which line, or which machine spent it. Energy monitoring samples constantly, so patterns become visible.
Broken down by location matters because your utility meter sits at the front gate. It measures everything at once. Energy monitoring adds measurement points further inside, so you can separate the compressor room from the injection moulding line from the office air conditioning.
Put simply: your utility meter tells you what you owe. Energy monitoring tells you why you owe it.
What Is an Energy Monitoring System?
An energy monitoring system is the combination of devices and software that turns raw electrical activity into a readable picture. People also call it an industrial energy monitoring system, and in larger deployments it becomes part of an energy management system, which we will separate out shortly.
The components of an energy monitoring system are consistent regardless of vendor:
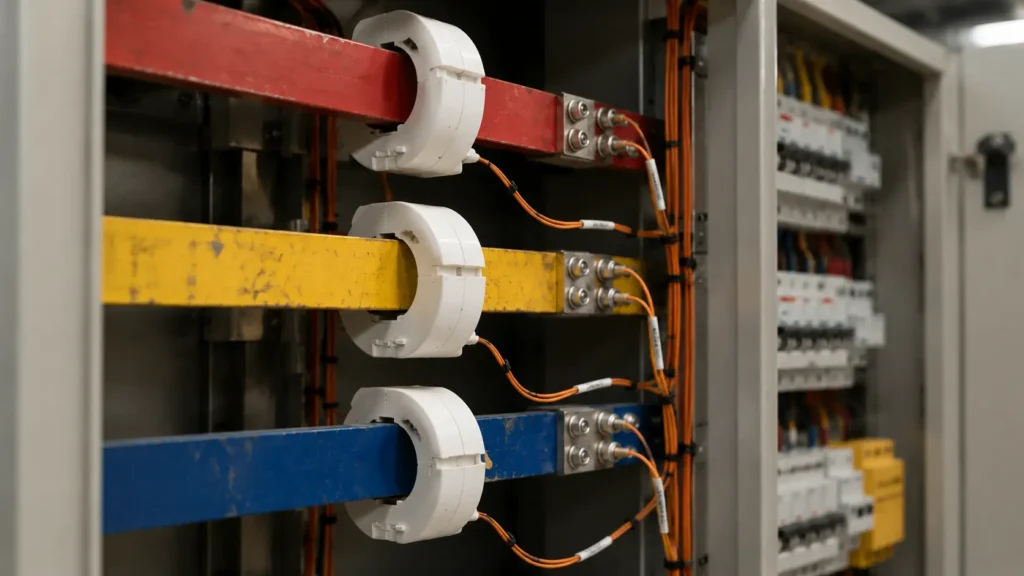
- Sensors. Usually clamp-on current transformers, or CTs, that fit around a conductor without cutting it. Voltage is picked up separately. Together they let the device calculate real power.
- A metering device. The small unit that reads the sensors, does the maths, timestamps the result, and holds it.
- Connectivity. Wired or wireless transport that moves the readings somewhere useful. In industrial settings the common protocols are HTTP, MQTT, and Modbus TCP.
- A destination. A dashboard, a database, a SCADA or MES system, or your existing platform.
- Alerts and reports. Thresholds that tell a human when something is wrong, plus the summaries that go to the finance meeting.
Notice what is not on that list. You do not need to replace machines. You do not need to rewire the plant. Modern energy monitoring is a retrofit exercise, which is exactly why older factories adopt it first.
How Does an Energy Monitoring System Work?
Here is the sequence, start to finish.
The Four Steps, Explained
Step one: measure. A clamp-on CT sensor closes around a live conductor and senses the magnetic field the current produces. More current means a stronger field. The sensor never touches the conductor itself, which is why installation is quick and does not require cutting power for long.
Step two: calculate. The device combines current with voltage, and with the phase relationship between them, to work out real power in kilowatts. It then accumulates that power over time to produce energy in kilowatt-hours. This is also where power factor gets calculated, because the device can see both the real and the apparent power.
Step three: transmit. Readings leave the device on a schedule, often every few seconds. Because industrial plants rarely start from a blank slate, good devices speak more than one language. HTTP suits simple integrations, MQTT suits high-frequency streaming to a broker, and Modbus TCP suits plants that already run SCADA.
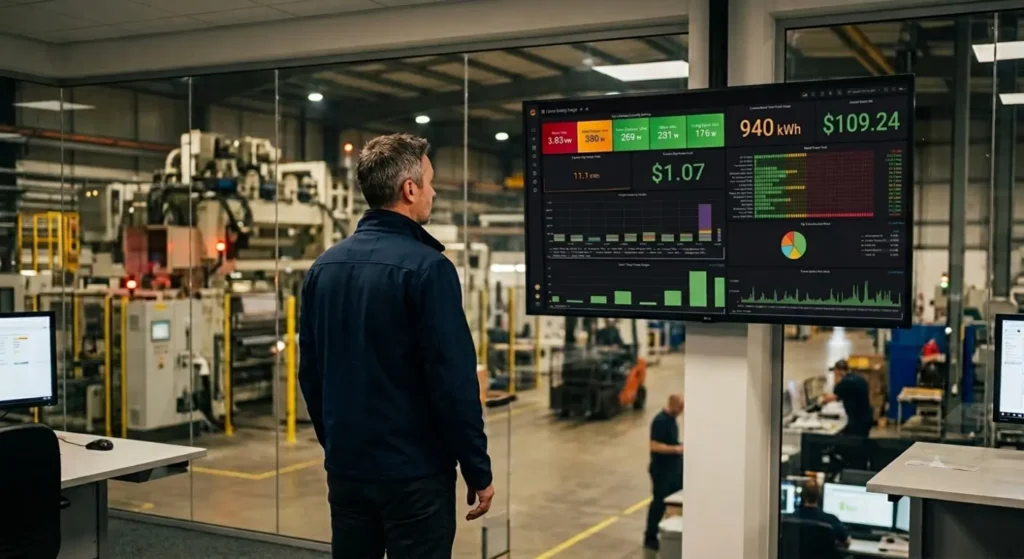
Step four: interpret. Raw readings become a load profile, which is simply a chart of consumption against time. Once you have a load profile, everything else follows. Peaks become visible. Idle waste becomes visible. Shift-to-shift differences become visible.
Real-time energy monitoring means those four steps repeat continuously rather than monthly. Energy consumption tracking is the accumulated record they leave behind.
Your Electricity Bill, Decoded
Now for the part that makes energy monitoring click.
Most factory managers can read a bill’s total. Far fewer can explain why the total moved. That is not a knowledge failure, because industrial tariffs genuinely are complicated, and they are complicated for reasons that have nothing to do with you and everything to do with how grids are built.
So let us take the terms one at a time.
kW vs kWh: Speed vs Distance
This is the single most useful distinction on the page, and the analogy that fixes it permanently is a car.
kW is speed. kWh is distance.
A kilowatt is a rate. It describes how fast you are drawing electricity at this instant. A 10 kW motor draws 10 kilowatts whenever it runs, in the same way a car travelling at 80 km/h is travelling at 80 km/h regardless of how long the trip lasts.
A kilowatt-hour is an amount. It describes how much electricity you consumed in total. Run that 10 kW motor for three hours and you have consumed 30 kWh, in the same way a car at 80 km/h for three hours has covered 240 km.
So the difference between kW and kWh in simple terms: kW is how hard you are pulling right now, kWh is how much you pulled altogether. Your bill charges you for both, separately, and for different reasons.
| kW | kWh | |
|---|---|---|
| What it is | Rate of use, right now | Total used over a period |
| Car analogy | Speed | Distance |
| Why the utility cares | They must build infrastructure big enough for your fastest moment | They must generate and deliver every unit you actually consumed |
When you see “what is kWh on electricity bill,” this is the answer: kWh is the consumption line, the fuel you burned. It is usually the biggest single item, and it is the one everyone assumes is the whole bill. It is not.
kVA vs kW: Why Two Numbers for the Same Power?
Here is where most people get stuck, so we will go slowly.
Alternating current has an awkward property. Some equipment, especially motors, transformers, and anything with a coil in it, does not just consume electricity. It also borrows some, uses it to build a magnetic field, and then pushes it back into the grid as the field collapses. That borrowing and returning happens sixty times a second, forever, and it never turns into useful work.
That gives us three quantities, and the vocabulary is worth learning properly:
- Real power (kW). The part that becomes actual work: torque, heat, light, motion. Also called active power.
- Reactive power (kVAR). The part that gets borrowed and returned. It does no work, but the wires still have to carry it.
- Apparent power (kVA). The total the grid actually has to deliver: real and reactive combined. Also called total power.
The distinction between apparent power and real power, or between active power and reactive power, is not academic. Your cables, transformers, and switchgear must be sized for kVA, because kVA is what physically flows through them. But only kW does anything for you.
That is why industrial bills quote kVA. The utility sized your connection for apparent power, so in many tariffs they charge you for apparent power.
On kVA vs kWh: these are not comparable, and mixing them up is common. kVA is a rate, like kW. kWh is an accumulation. The accumulated equivalent of kVA is kVAh, and kVAh billing is exactly what it sounds like. Where a utility bills on kVAh, you pay for total delivered power over time, not just the useful portion. Under that structure, wasted reactive power costs you real money every hour of every day.
So when you ask “what does kVA mean on my bill,” the honest answer is: it is the gap between what the grid delivered and what your plant used. The bigger the gap, the more you pay for nothing.
Power Factor: The Number Behind the Number
The ratio is simple: Power factor = real power (kW) divided by apparent power (kVA)
It lands between 0 and 1. A power factor of 1.0 means every unit delivered became useful work. When it hits 0.7, only seventy percent did useful work, and the other thirty percent sloshed back and forth doing nothing while you paid for the pipe that carried it.
Power factor explained through the classic image: pour a beer badly and you get liquid plus foam. The liquid is kW. The foam is kVAR. The full glass is kVA. You wanted beer. You paid for the glass.
What causes a poor power factor in a factory? Mostly lightly loaded induction motors. A motor running at twenty percent of its rated load has a far worse power factor than the same motor running at eighty percent. Oversized motors, idling equipment, and old transformers all drag the number down.
What is a good power factor for a factory? Most utilities set a target in the 0.90 to 0.95 range and penalise you below it, though the exact threshold and penalty vary by utility and by country. Check your own tariff document rather than assuming, because this is one of the few bill parameters that differs meaningfully between regions.
The reason power factor belongs in an energy monitoring article is that you cannot fix what you cannot see. Power factor is calculated continuously by the metering device, per circuit. That means you can find the specific machine dragging the plant average down, rather than treating the whole site with one expensive correction bank and hoping.
Demand Charges: Paying for Your Worst 15 Minutes
Now the line item that surprises people most.
A demand charge is a fee based on your highest rate of consumption during the billing period, not your total consumption. It is priced per kW, and it is billed on top of the kWh consumption charge.
Why does that exist? Because the grid must be built for your worst moment. If your plant sits at 200 kW all month but spikes to 700 kW for one fifteen-minute window when three compressors and a furnace all start together, the utility still had to size transformers, cables, and generation capacity for 700 kW. The consumption charge does not recover that. The demand charge does.
Here is the mechanic that catches everyone. Demand is not instantaneous. Utilities average consumption over a fixed window, and the U.S. Department of Energy’s guide to understanding electricity bills, published through the Better Buildings Solution Center, notes that this window is commonly fifteen minutes, and gives a clean worked example: a facility consuming 25 kWh within a fifteen-minute window registers 100 kW of demand. You can read the full guide here: Understanding Your Utility Bills: Electricity, U.S. Department of Energy.
Read that example again, because it explains the whole billing structure. Demand is a fifteen-minute average, so a two-second inrush does not set your peak. But a poorly sequenced startup that keeps three big loads running together for twenty minutes absolutely does.
| Energy charge | Demand charge | |
|---|---|---|
| Measures | Total consumption | Highest averaged rate |
| Unit | kWh | kW |
| Question it answers | How much did you use? | How big did you get? |
| Set by | The whole month | One window in the whole month |
| Reduced by | Using less overall | Not using it all at once |
Peak demand kW explained in one sentence: it is the single highest fifteen-minute average your plant hit, and it sets a charge you pay for the entire month.
One more term worth knowing early. Some tariffs include a demand ratchet clause, which means a peak set in one month keeps setting a minimum billed demand for months afterwards. Where a ratchet applies, a single bad startup on a single Tuesday can follow you into next quarter. Check whether your tariff has one.
The connection to energy monitoring is direct. Peaks last fifteen minutes. Bills arrive after thirty days. Without monitoring, you learn about a peak roughly four weeks after you could have done anything about it. With monitoring, you see it forming.
Peak vs Off-Peak: When You Use It Matters
The last piece is timing.
Electricity does not cost the same at every hour. Grids run cheap baseload plants first and expensive peaking plants last, so the marginal cost of a kilowatt-hour at 8pm on a hot evening is far higher than at 3am. Utilities pass that through with time of use rates.
Time of use electricity rates explained: your day is divided into named blocks, typically peak, off-peak, and sometimes shoulder, and each block has its own price per kWh. Peak vs off-peak spreads vary widely by utility and by season, so pull your own tariff sheet.
This is where energy monitoring stops being informational and starts being financial. If you know that your induction furnace draws 400 kW and you know your peak window starts at 6pm, then moving one melt cycle earlier is not a guess. It is arithmetic.
Two related terms complete the picture:
Load factor is your average demand divided by your peak demand, expressed as a percentage. A load factor of 90 percent means you run steadily. A load factor of 40 percent means you have big spikes over a low baseline, and you are paying demand charges for capacity you rarely use. Low load factor is the classic symptom of a plant that would benefit from monitoring first and scheduling second.
Load profile is the chart behind the load factor. It is the shape of your day. Almost every insight in industrial energy work starts by looking at one.
Energy Monitoring vs Energy Management vs Energy Audits
Three terms get used interchangeably, and they should not be.
| What it is | Timeframe | Output | |
|---|---|---|---|
| Energy audit | An expert visits, measures, and reports | One-off, days to weeks | A document with recommendations |
| Energy monitoring | Permanent measurement of use over time | Continuous, forever | Live data and alerts |
| Energy management | The programme that acts on the data | Ongoing organisational effort | Decisions, targets, savings |
So, is energy monitoring the same as energy management? No. Monitoring is measurement. Management is what you do with the measurement. An energy management system, or EMS, is the software layer plus the process. Industrial energy management system, or IEMS, is the same idea scoped to plants. Energy monitoring and targeting, usually shortened to M&T, is the specific discipline of comparing measured consumption against an expected target and investigating the gap.
Energy audit vs energy monitoring is the useful comparison for a factory manager deciding where to start. An audit is a photograph. Monitoring is a video. Audits are excellent at finding structural problems once. They are hopeless at catching the compressor that started leaking three weeks after the auditor left.
The honest sequence for most plants: monitor first, because monitoring is what turns every later decision from opinion into evidence.
Where the Meters Go: Site, Line, Machine
Sub-metering, sometimes written submetering, means adding meters downstream of your utility meter. It is the practical heart of energy monitoring, and it works in layers.
- Level 1: site. One meter at the incomer. This mirrors your bill and validates it. Useful, but it only tells you what you already pay for.
- Level 2: distribution. Meters on major feeders or panels. Now you can separate production from HVAC from lighting from the compressor room. For many plants, this layer alone finds the first round of savings.
- Level 3: machine. Machine level energy monitoring puts a meter on individual assets. This is where the interesting things surface. Specific machines have specific signatures, and once you know the normal signature, deviations mean something. A motor drawing more current for the same output is telling you about bearing drag long before it fails.
Plant energy monitoring usually starts at level 2 and grows into level 3 on the assets that matter. Nobody meters everything on day one, and nobody should. Energy monitoring for industrial plants works best as a staged rollout: meter the biggest consumers, learn, extend.
What Factory Managers Actually Do With the Data
Data is not the deliverable. Decisions are. Here is what energy monitoring in factories actually produces once it has been running for a month.
- A baseline. You finally know what normal looks like. Everything after this is measured against it.
- Waste discovery. The classic finds are unglamorous and repeatable: equipment running through breaks and weekends, compressors loading against a leak, chillers fighting an open door, extraction fans left on after a shift ends. None of these are visible on a monthly bill. All are obvious on a load profile.
- Peak visibility. You see how your peak forms, which loads coincide, and whether staggering startups would flatten it.
- Power factor targeting. You see which circuit is the actual offender.
- Energy KPIs for manufacturing. The most important one is specific energy consumption, or SEC: energy used per unit produced. SEC is the metric that survives contact with a busy plant, because it separates “we used more electricity” from “we made more product.” A rising SEC with flat output is a problem. A rising bill with rising output might be perfectly healthy.
- A compliance foundation. If your organisation is heading toward ISO 50001, continuous measurement is not optional. The standard is built on a measured energy baseline and demonstrated improvement against it.
- Maintenance signal. This one surprises people. Electrical current is one of the earliest indicators of mechanical trouble, which is why current sits alongside vibration and temperature in condition monitoring. Energy data and machine health data are the same data, read for different purposes.
Once you have the picture, the next question becomes what to change. That is a full topic on its own, and we cover it in the next guide in this series: How to Reduce Energy Consumption in a Factory: The Complete Guide.
The Hardware, in Plain English
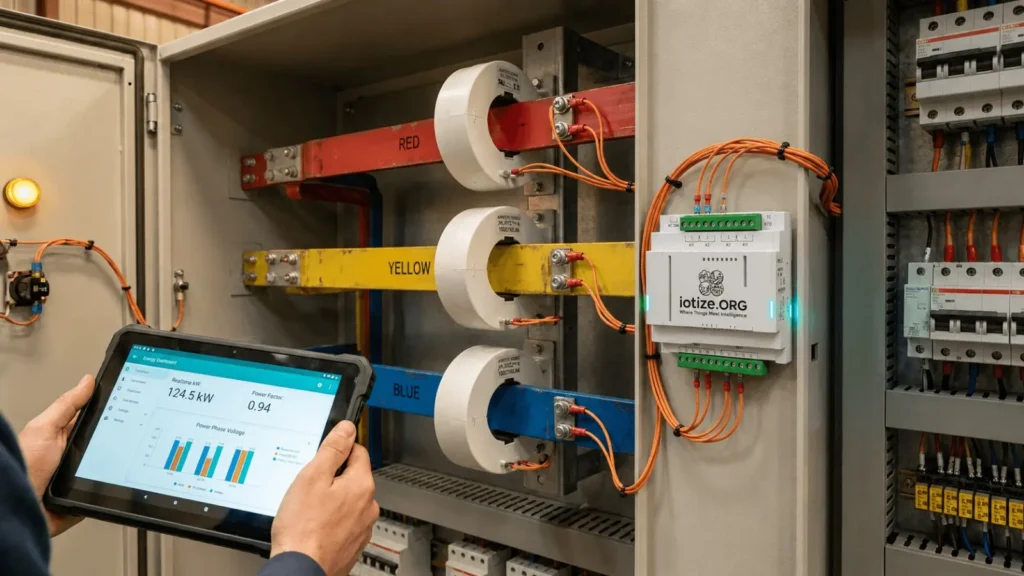
You asked what energy monitoring is, so let us be concrete about what actually gets installed. IoT energy monitoring devices are small, they mount in or near your existing panel, and they attach to conductors with clamp-on CT sensors rather than cut-in meters. That is what makes retrofit energy monitoring viable on machines built decades before anyone said “IIoT.”
For context, here is how IoTize.ORG groups its own energy monitoring sensors. Treat this as an orientation to the categories, not a shopping list. You are at the “what is this” stage, and that is the right place to be.
Affordable Series, fixed price, for legacy factories
Smart Energy & Hour Monitoring IoT Device, Single-Phase, $99. Single-phase energy monitoring plus runtime hours, speaking HTTP, MQTT, and Modbus TCP. Designed for putting a first meter on a machine without a project.
Enterprise Series, quote-based, for smart factories
- IoT Smart Energy Monitoring Sensor, Single-Phase. Single-phase energy monitoring for plants integrating into SCADA, MES, or an existing platform. HTTP, MQTT, Modbus TCP.
- IoT Smart Energy Monitoring Sensor, Three-Phase. Three-phase energy monitoring using three CT clamps, for the three-phase feeders and machines that carry most of an industrial plant’s load. Separate device from the single-phase unit. HTTP, MQTT, Modbus TCP.
The distinction that matters most at this stage is single-phase versus three-phase. Small machines, lighting circuits, and office loads are usually single-phase. Motors, compressors, furnaces, and main feeders are usually three-phase. Metering a three-phase load needs a three-phase device, because it has to measure all three conductors. If you take one hardware fact away from this article, take that one.
If you want the wider view of how measurement, targeting, and reduction fit together, the IoTize Energy Efficiency solution page lays it out.
Where to Start
- First, read your own tariff document. Not the bill, the tariff. Find out whether you are billed on kWh or kVAh, whether there is a demand charge and over what interval, what the power factor threshold and penalty are, whether a ratchet clause applies, and when your peak windows run. Every one of those varies. Assuming is expensive.
- Second, find your biggest three loads. You almost certainly already know what they are. Compressors, motors, furnaces, chillers. Those are where a first meter earns its keep.
- Third, ask what you would do differently if you could see them live. If the answer is “nothing,” you do not need monitoring yet. For most factories, the answer arrives immediately, and it is usually about scheduling, idling, or a machine everyone already suspects.
- Fourth, start small and stage it. Meter the big loads, run for a month, look at the load profile, and let what you find decide the next step.
Energy monitoring for factory managers is not a technology decision at heart. It is a decision to stop guessing. The hardware is the easy part.
The short version
- Energy monitoring means measuring electricity use continuously, broken down by location, so you can see where it goes and when.
- kW is speed, kWh is distance. kVA is everything the grid delivered, kW is the part you used, and power factor is the ratio between them.
- Demand charges bill your highest averaged interval, commonly fifteen minutes, not your total. One bad startup can set a month’s charge.
- Time of use rates mean the same kWh costs different amounts at different hours.
- Monitoring is measurement. Management is action. Audits are photographs, monitoring is video.
- Start with your biggest loads, stage the rollout, and let the load profile tell you what to do next.
Frequently asked questions
What is the difference between kW and kWh in simple terms?
kW is a rate and kWh is an amount. Think of a car: kW is your speed, kWh is your distance. A 10 kW motor always draws 10 kW while running, but it consumes 30 kWh if it runs for three hours. Your bill charges for both, for different reasons.
What does kVA mean on my bill?
kVA is apparent power, the total power the grid physically delivered to you. kW is real power, the part that became useful work. The difference is reactive power, which gets borrowed by motors and transformers and pushed back without doing anything. Because your cables and transformers must be sized for kVA, many industrial tariffs bill on it.
Why do factories pay demand charges?
Because the grid has to be built for your worst moment, not your average one. If your plant normally sits at 200 kW but hits 700 kW for fifteen minutes, the utility still had to size its infrastructure for 700 kW. The demand charge recovers that capacity cost, priced per kW of peak.
Why is my electricity bill high even though usage went down?
Three usual suspects. You may have set a higher peak demand, which is billed on your worst interval regardless of total consumption. Your power factor may have slipped below the threshold, adding a penalty. Or your usage may have shifted into peak-rate hours, where the same kWh simply costs more. All three are invisible on a monthly bill and obvious with monitoring.
Is energy monitoring the same as energy management?
No. Energy monitoring is the measurement layer: sensors, meters, and data. Energy management is the programme that acts on it: targets, decisions, and changes. An energy management system, or EMS, is the software and process around the data. Monitoring without management produces dashboards nobody uses.
What is a good power factor for a factory?
Most utilities target 0.90 to 0.95 and apply a penalty below their threshold, but the exact number and the penalty structure differ by utility and by country. Check your own tariff document. Lightly loaded and oversized motors are the most common cause of a poor factory power factor.
How much does energy monitoring save?
It depends entirely on your tariff, your load profile, and what you change once you can see it, so treat any universal percentage with suspicion. What monitoring reliably does is make three specific savings possible: eliminating out-of-hours running, flattening demand peaks, and correcting power factor at the offending circuit. The size of each is site-specific and should be modelled against your own bill.
What is the difference between an energy audit and energy monitoring?
An audit is a one-off expert assessment producing a report. Monitoring is permanent measurement producing live data. An audit is a photograph, monitoring is a video. Audits find structural issues well. Only monitoring catches the problem that starts three weeks after the auditor leaves.
What is sub-metering?
Sub-metering means installing meters downstream of your utility meter to measure specific parts of the plant: a feeder, a line, or an individual machine. It is what lets you attribute cost to a source rather than to the whole site.
Do I need a three-phase device or a single-phase one?
It depends on the load. Lighting circuits, small machines, and office loads are usually single-phase. Motors, compressors, furnaces, and main feeders are usually three-phase, and metering them accurately requires a three-phase device that measures all three conductors. They are separate products, not settings.