

Production Monitoring and OEE Monitoring Systems for the Shop Floor
You cannot improve what you do not count. An IoTize OEE monitoring system puts an IoT production counter on the machine, so runtime, idle time, and real output stream live to your dashboard, SCADA, or MES.
Start on one machine for a fixed price, see where the hours actually go, then scale plant-wide.
Industrial IoT since 2015 · Cloud, private cloud, or on-premises · HTTP, MQTT, and Modbus TCP
The Real Cost of a Shop Floor You Cannot See
Ask a plant manager how a line performed yesterday and you often get a feeling, not a number. The machine “ran most of the day.” Output was “about where it should be.” Nobody logged the three short jams at the infeed, the long changeover after lunch, or the twenty minutes spent chasing a part.
Those minutes never make it to the report, so they never get fixed. An OEE monitoring system replaces the guess with live runtime, idle time, output, and stop events from each machine.
- Idle capacity you already own: machines that look busy may be waiting for material, an operator, or an upstream process.
- Micro-stops that never get counted: a ninety-second jam feels small, but repeated stops remove real output.
- Targets missed in silence: an end-of-shift spreadsheet arrives too late to recover the shift.
- Improvement aimed at the wrong machine: teams attack the loudest problem instead of the largest measured loss.
- Late, inaccurate manual entry: clipboards and end-of-shift tallies often miss short losses.
The fix is not a bigger spreadsheet. It is an IoT production counter that watches the machine and reports the truth in real time.
OEE Monitoring by the Numbers
Source: Lean Production OEE benchmarks. The 42% figure is calculated as (85 minus 60) divided by 60. Industry benchmarks, not a guarantee.
What an OEE Monitoring System Actually Does
An OEE monitoring system answers one honest question about every machine: of the time you planned to run, how much became good product? It captures Availability, Performance, and Quality machine by machine, then turns them into a score your team can act on.
One number at shift end. Guesswork and clipboards.
Runtime, idle, and output live. Every stop becomes visible.
OEE tracked, losses ranked, biggest waste designed out.
The first jump matters most: moving from blind to counted. You cannot rank losses or aim an improvement project until the machine reports real numbers. That is the job of an IoT production counter.
How an IoT Production Counter Works
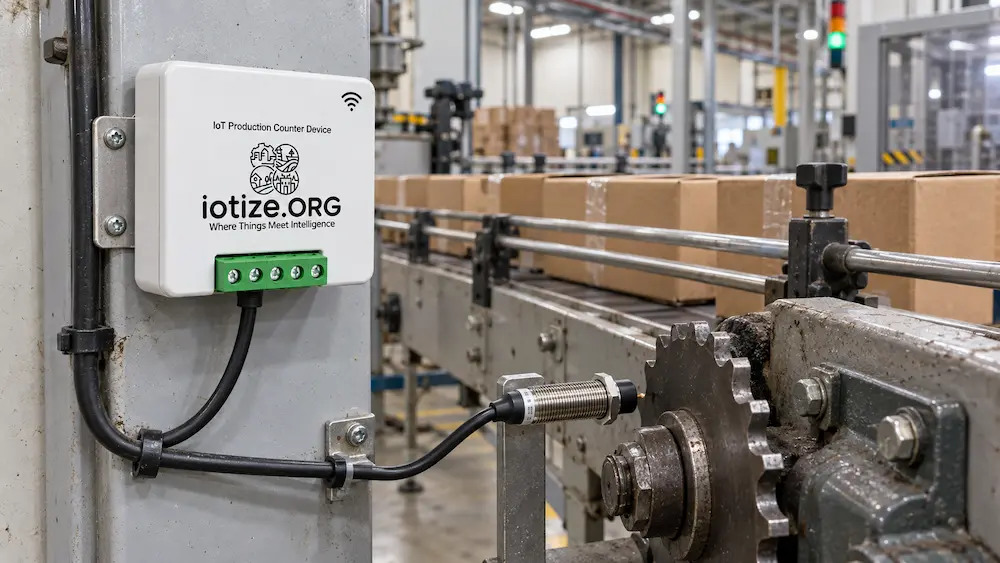
A production counter is a small, non-invasive retrofit device that senses the machine’s real motion, counts at the edge, and streams the result. It does not require a new PLC program or replacement of existing controls.
- Sense: an inductive proximity or Hall sensor detects a moving machine element, while an incremental encoder provides A/B/Z signals for high-resolution count and direction.
- Count at the edge: the device tracks runtime, idle time, cycle rate, RPM, and stop events with timestamps.
- Connect: the Affordable counter uses Wi-Fi. The Enterprise counter supports Ethernet or Wi-Fi plus HTTP, MQTT, and Modbus TCP.
- Deliver: data reaches a live dashboard and can feed SCADA, MES, ERP, or your own cloud.
- Act: when a line stalls or misses its rate, the team can respond inside the shift.
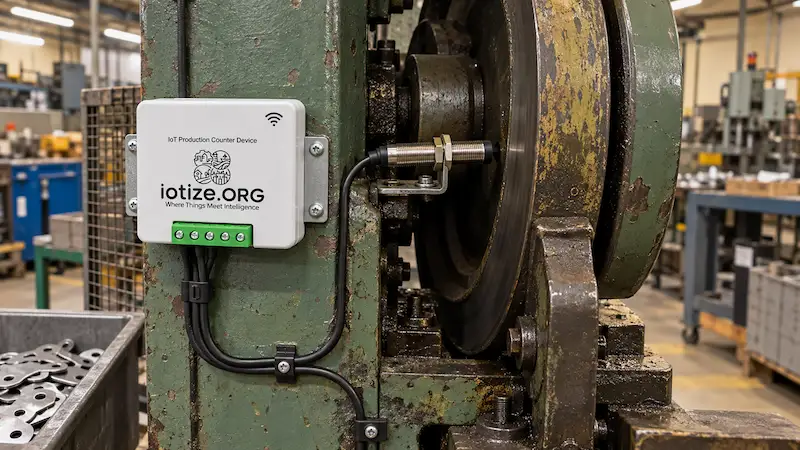
Important sensor note: an inductive proximity sensor detects metal. Aim it at the machine’s own moving metal, such as a sprocket, cam, crank, or shaft, so one cycle equals one unit. If you must count cardboard, plastic, or glass directly on the belt, tell the IoTize team so the correct sensor can be scoped.
This approach aligns with peer-reviewed research on non-invasive machine-utilization monitoring, where machine signals were used to classify operating states and improve scheduling.
What Production Monitoring Lets You See and Control
- Runtime versus idle time: reveals true machine utilization and hidden idle capacity.
- Unit count versus target: catches a missed target during the shift, not after it.
- Cycle rate or RPM: exposes slow-running conditions and lost output.
- High and low RPM alerts: flag abnormal speed, jams, overload, and potential quality risk.
- Reverse motion with encoder A/B/Z: separates productive strokes from corrections, mis-feeds, and rework.
- Timestamped stop events: rank when, how often, and how long a line stops.
OEE Math Explained Simply
OEE = Availability × Performance × Quality. Each factor is between 0 and 1, and together they capture every major way a machine loses productive time.
Availability = Run Time / Planned Production Time. This captures breakdowns, changeovers, and waiting.
Performance = (Ideal Cycle Time × Total Count) / Run Time. This captures slow cycles and micro-stops.
Quality = Good Count / Total Count. This captures defects and rework.
Three strong-looking scores still leave more than a quarter of planned productive capacity unrealized.
Micro-stop threshold: plants often classify stops longer than a chosen threshold against Availability and shorter stops against Performance. Set the threshold to match your reporting standard.
Ideal Cycle Time: Performance requires the expected speed for the part being produced. Configure it once per part or product.
Quality input: the counter measures units. To calculate the Quality factor, feed it a good-versus-reject signal or connect inspection or scrap data. Availability and Performance are available from machine motion; Quality needs reject data.
Quick OEE Calculator
The Six Big Losses: What to Fix First
An OEE score shows how much production is being lost. The Six Big Losses show where it goes, turning one number into a practical improvement list.
- Breakdowns, Availability: long unplanned stops with timestamps and duration.
- Setup and adjustment, Availability: changeovers, tool changes, warm-up, and first-off checks.
- Idling and minor stops, Performance: short jams, misfeeds, blocked chutes, and gaps that manual logs miss.
- Reduced speed, Performance: cycle rate or RPM below the ideal rate.
- Process defects, Quality: total count compared with good count after reject data is connected.
- Reduced yield, Quality: reject clusters after startup, warm-up, or changeover.
Start with the largest measured loss, fix it, then rank the losses again.
Affordable vs Enterprise: Which Production Counter Fits?
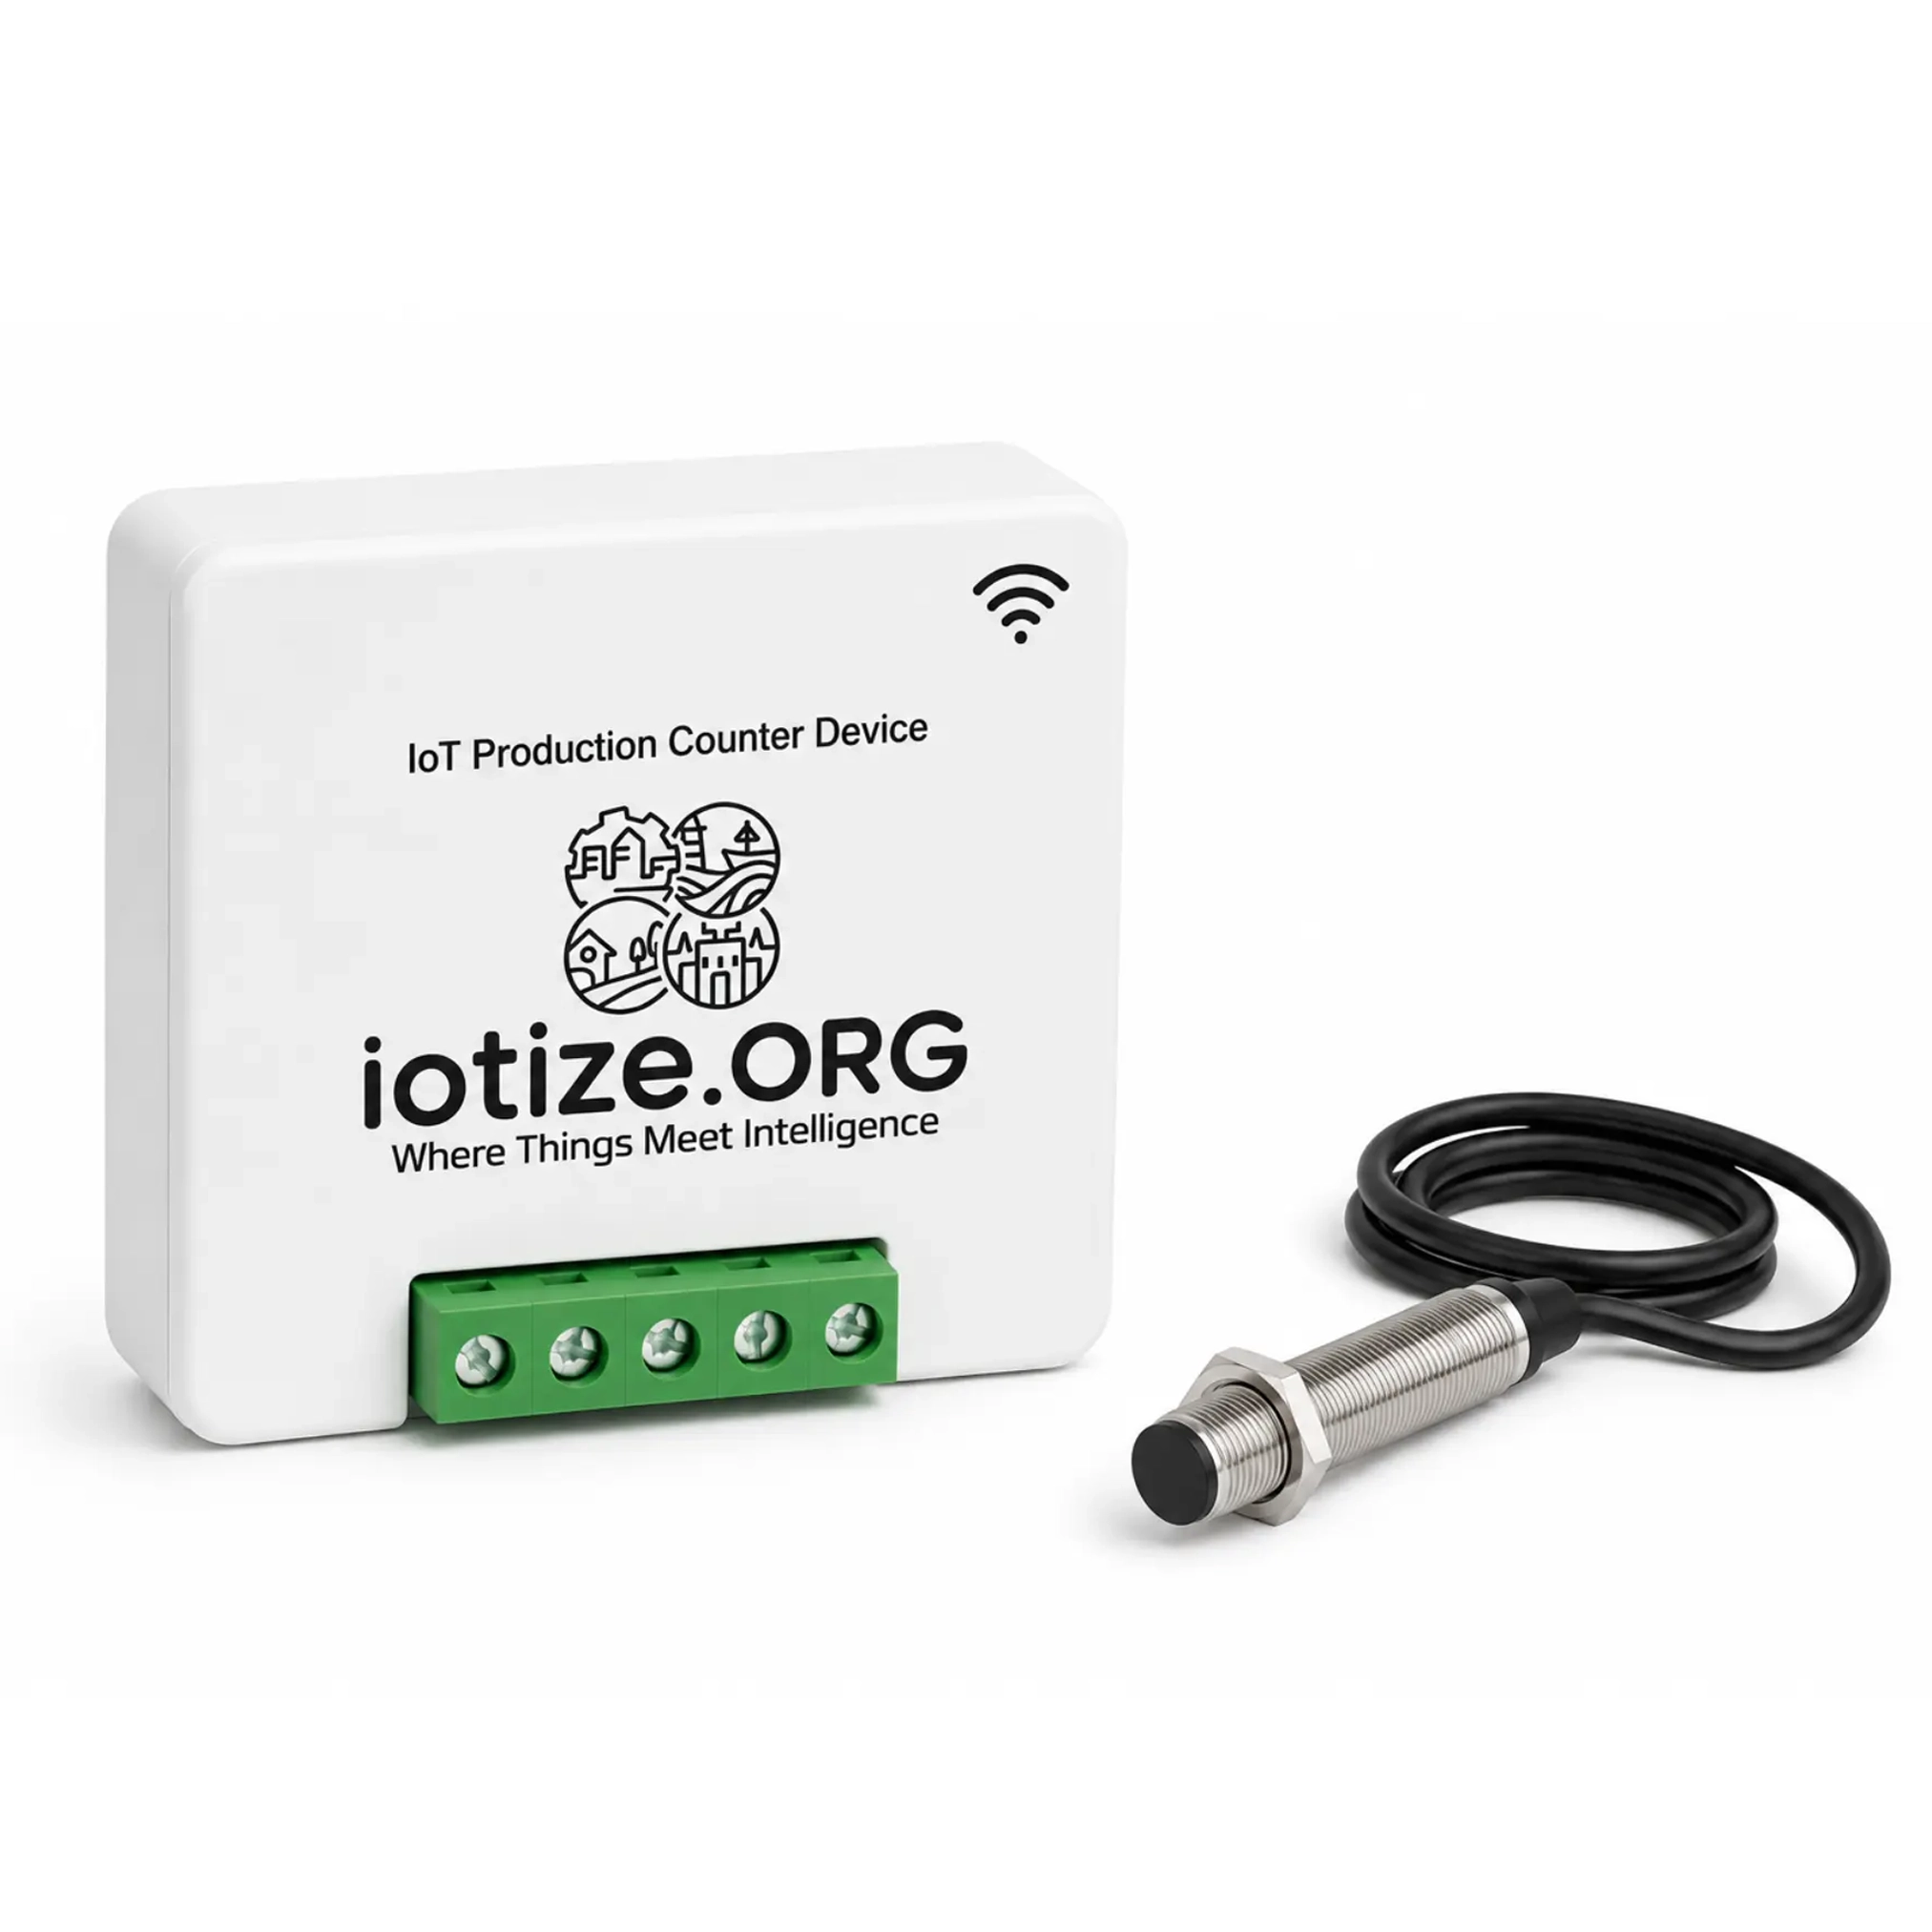
Choose the Affordable IoT Production Counter when you need runtime, idle time, output, and RPM alerts on a simple, hand-fed, or legacy machine. Its live price is $80.
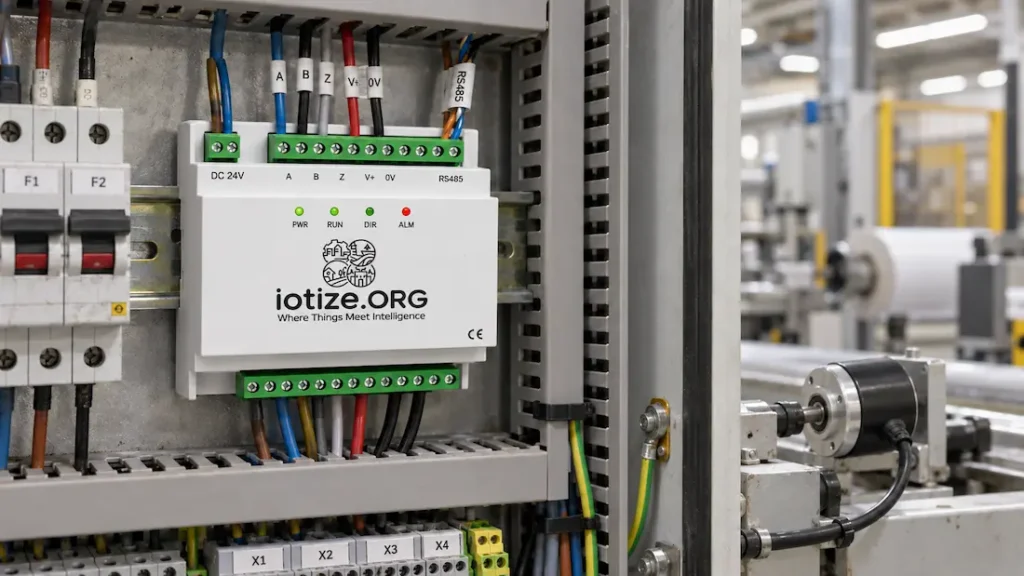
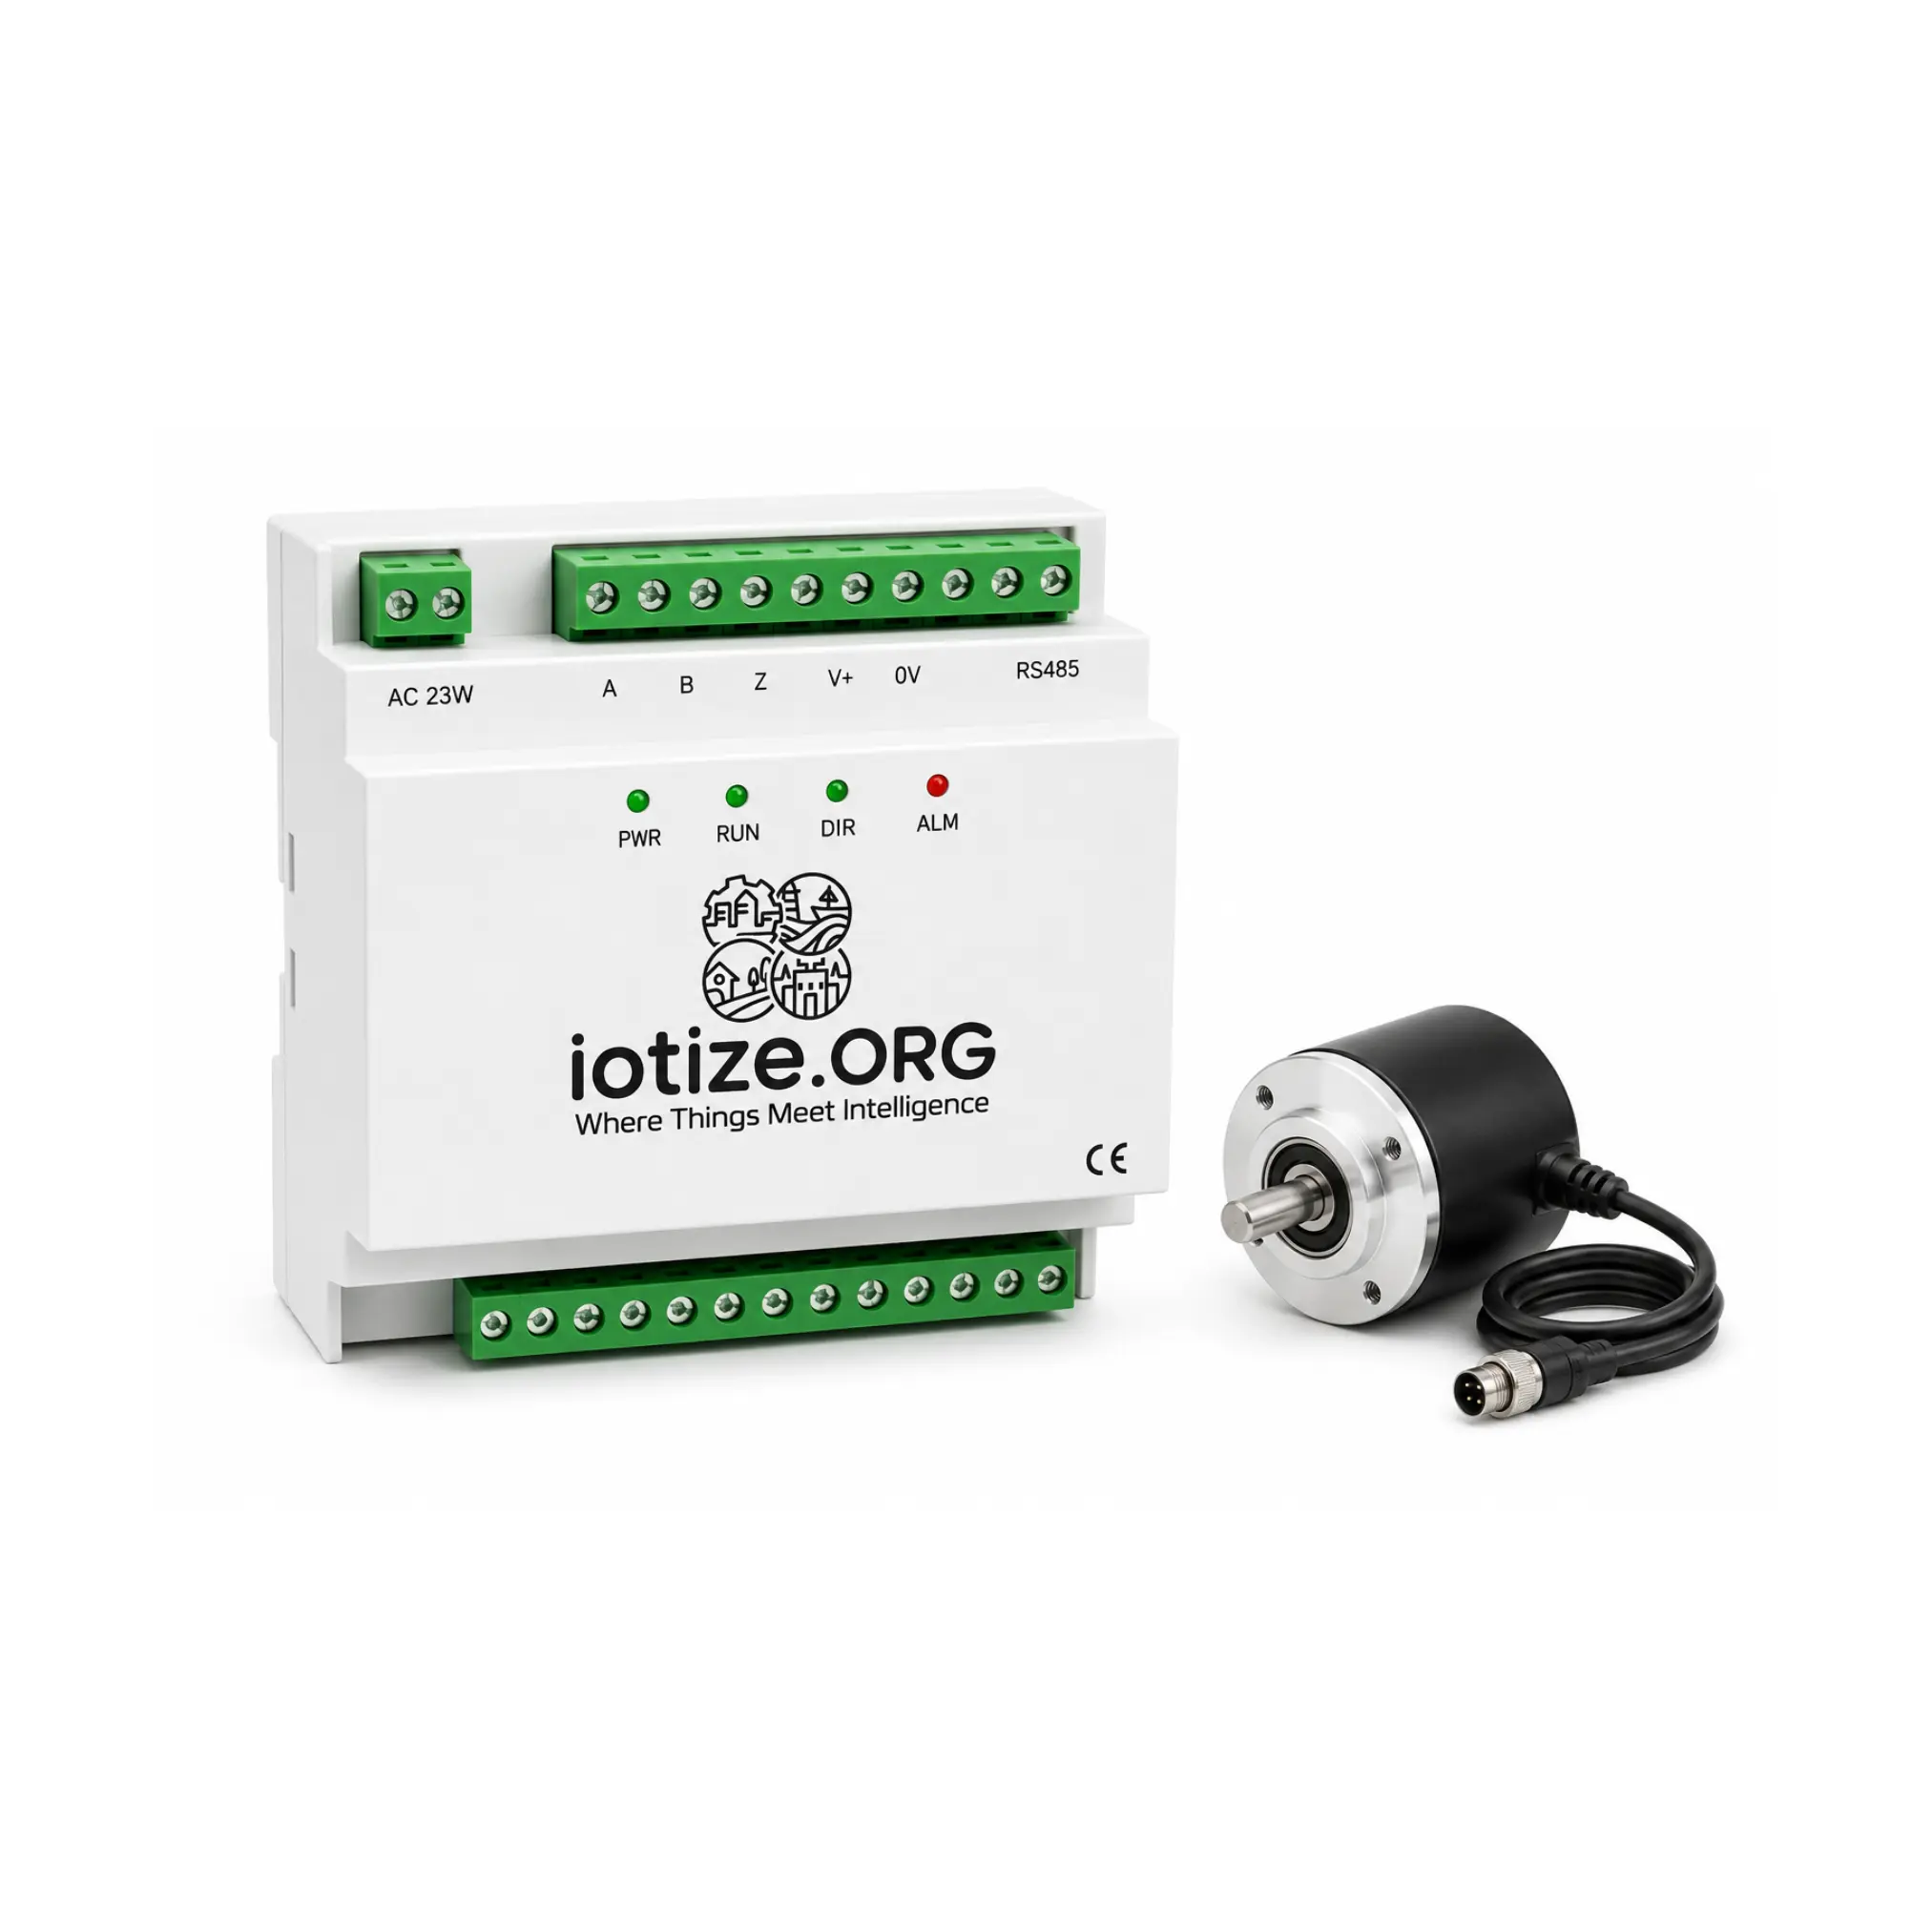
Choose the Enterprise IoT Production Counter when you need high-resolution encoder counting, forward and reverse detection, a configurable multiplier, and direct SCADA or MES integration. Pricing starts at $160 and final configuration is confirmed by quote.
| Affordable Counter | Enterprise Counter | |
|---|---|---|
| Price | $80 | From $160, quote-configured |
| Sensing | Hall or proximity input | Incremental encoder, A/B/Z |
| Measures | Output, runtime, idle, high/low RPM | High-resolution count, runtime, idle, reverse, high/low RPM |
| Direction | Forward/event count | Forward and reverse |
| Power | 12 V DC | 12 to 24 V DC |
| Connectivity | Wi-Fi, HTTP and MQTT | Ethernet or Wi-Fi, HTTP, MQTT, Modbus TCP |
| Best fit | Simple, legacy, or hand-fed machines | Textile, CNC, robotics, packaging, molding, direct SCADA or MES |
The IoTize Production Counters
60-Second Production Counter Selector
Which counter fits your machine?
Choose the statement closest to your requirement.
Want the Full Picture First?
Ask for the Production Monitoring Buyer’s Guide, a short PDF matching machine types to the right counter and explaining each step toward OEE monitoring.
Deploy Your Way and Keep Control of Your Data
You choose where production data lives. Use IoTize Cloud for a fast start, deploy privately for tighter control, or connect counters to your own operational systems. See the verified IoTize monitoring platform and plans.
Hosted dashboards, alerts, export, and history. Plans start at $29 per month.
Enterprise deployment under your own license, with configurable history.
HTTP, MQTT, or Modbus TCP into SCADA, MES, ERP, or your own cloud.
Cloud Starter begins at $29 per month and Cloud Pro begins at $99 per month. Enterprise deployment is quoted. Final cost depends on device count, data rate, retention, custom dashboards, and deployment choice.
Your OEE Dashboard, View by View
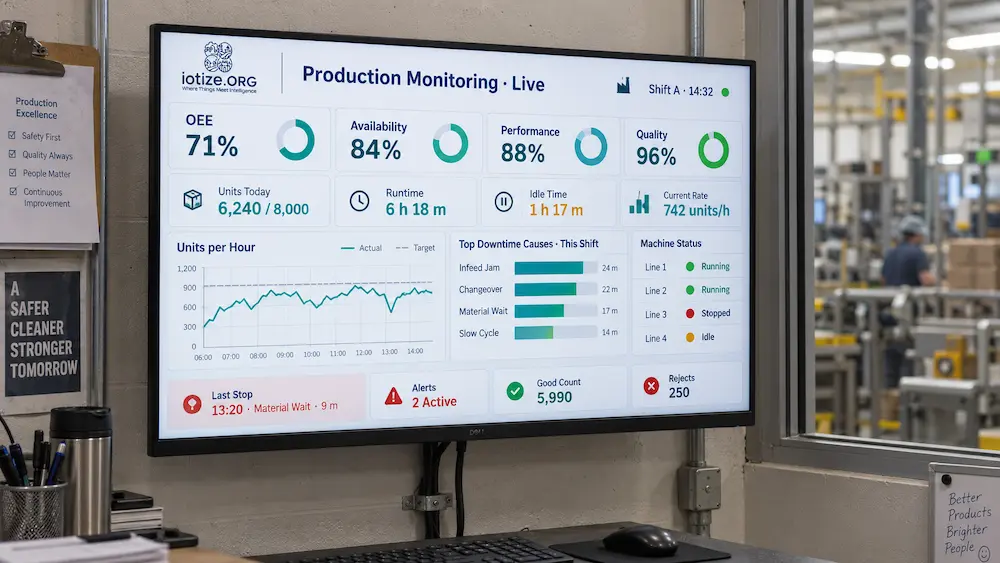
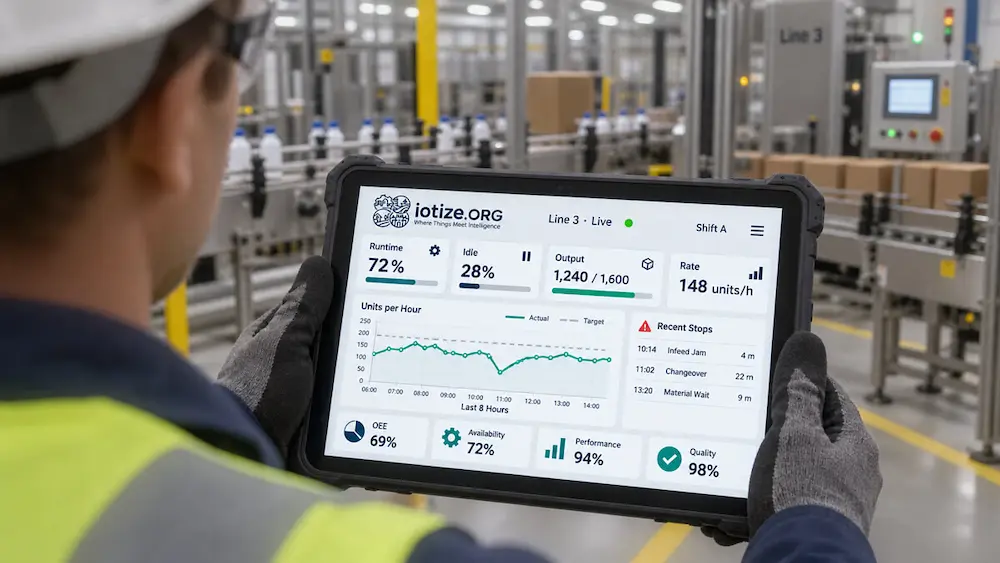
Counting is only half the value. The OEE dashboard turns machine signals into views that production teams can use during the shift.
- Plant overview: live status and OEE by machine, so supervisors can spot the weak line quickly.
- Machine drill-down: runtime, idle time, output versus target, and ranked stop history for one asset.
- Shift and trend reports: Availability, Performance, Quality, and OEE over time, so improvement becomes measurable.
Where Production Monitoring Pays Off
- Packaging or bottling: output versus target, jams, and micro-stops. Use Affordable or Enterprise depending on count precision.
- Textile or embroidery: stitch or rotation count, reverse motion, backstitch, and runtime. Use Enterprise A/B/Z.
- CNC or robotics: production cycles, direction, and speed loss. Use Enterprise.
- Injection molding or presses: shots, strokes, and idle time between cycles. Use Affordable or Enterprise.
- Hand-fed or legacy machines: true runtime versus idle time. Start with the Affordable counter.
- Whole shop floor: rank utilization across assets, mixing Affordable on simple lines and Enterprise on precision equipment.
How the Return Shows Up
The return on production monitoring comes from finding idle time you already pay for, capturing micro-stops that manual logs miss, and directing improvement work toward the largest measured loss.
Hardware starts at a fixed $80 for the Affordable counter. The hosted platform starts at $29 per month, while private and on-premises options are available for larger deployments. Payback depends on your process, labor, throughput, and response to the data.
Representative scenario, not a customer claim.
Situation: a six-line packaging plant repeatedly finishes below target, but end-of-shift reports cannot explain why.
Change: an Affordable counter is fitted to each line. The dashboard shows one line losing close to an hour per shift through repeated short infeed jams.
Outcome: the team corrects the infeed issue, then uses the same ranked-loss method on the next line. Actual results depend on the machines, product mix, and speed of response.
One Solution, Three Operational Lenses
- How much does the machine make? Production monitoring measures output, runtime, idle time, and OEE.
- Why might it stop? Add predictive maintenance and condition monitoring for vibration, temperature, and current trends.
- What does it cost to run? Add industrial energy efficiency monitoring for device-level electricity and idle-load waste.
Together, they provide output, health, and energy cost on the same IoT monitoring platform.
Industries We Serve
- Manufacturing and assembly
- Textile, apparel, and embroidery
- Packaging and bottling
- CNC, metalworking, and robotics
- Plastics and injection molding
- Food and beverage
The same production counters can monitor modern automated cells and hand-operated legacy machines, making a phased plant-wide rollout practical.
Why Choose IoTize for Production Monitoring?
- Real hardware and published starting prices: begin at $80 instead of waiting for a platform demo to learn the entry cost.
- Entry to enterprise: monitor one simple machine, then add encoder counting and direct SCADA or MES integration where needed.
- Retrofit approach: add sensing without replacing machine controls.
- Open protocols: HTTP, MQTT, and Modbus TCP support integration with existing systems.
- Flexible deployment: use IoTize Cloud, private cloud, on-premises, or direct integration.
- Pilot-first rollout: start with one machine or line, prove useful data, then scale.
Get Started in Five Steps
- Pick the hardest line: start where missed targets hurt most.
- Choose the counter: Affordable for a simple retrofit, Enterprise for encoder precision and direct integration.
- Connect the dashboard: bring runtime, idle time, and output live.
- Rank the biggest loss: fix the largest measured cause first.
- Scale line by line: add counters as each improvement validates the next step.
Ready to Count What Matters?
Put one IoTize production counter on your hardest machine, see real runtime, idle time, and output, then fix the biggest loss first.
Frequently Asked Questions
What Is an OEE Monitoring System?
An OEE monitoring system measures how effectively a machine turns planned production time into good output by tracking Availability, Performance, and Quality. IoTize uses production counters to capture machine motion, runtime, idle time, and output for dashboards, SCADA, or MES.
How Does an IoT Production Counter Work?
A non-invasive sensor reads real machine motion. The Affordable counter uses a Hall or proximity input, while the Enterprise counter uses incremental encoder A/B/Z signals for high-resolution count and direction. The device records events at the edge and sends data over supported network protocols.
What Is the Difference Between the Affordable and Enterprise Counters?
The Affordable counter costs $80 and covers output, runtime, idle time, and high/low RPM alerts for simple machines. The Enterprise counter starts at $160 and adds encoder A/B/Z counting, direction detection, configurable multipliers, and direct HTTP, MQTT, or Modbus TCP integration.
How Do I Calculate OEE?
Multiply Availability × Performance × Quality. Availability is Run Time divided by Planned Production Time. Performance is Ideal Cycle Time multiplied by Total Count, divided by Run Time. Quality is Good Count divided by Total Count.
What Are the Six Big Losses?
The Six Big Losses are breakdowns, setup and adjustment, idling and minor stops, reduced speed, process defects, and reduced yield. They map to the Availability, Performance, and Quality parts of OEE.
Can I Track OEE on Old or Hand-Operated Machines?
Yes. Production counters can read a moving machine element without replacing the control system. The Affordable counter is designed as a practical entry point for simple, hand-fed, and legacy machines.
What Power and Network Do the Counters Need?
The Affordable counter uses 12 V DC and Wi-Fi. The Enterprise counter uses 12 to 24 V DC and supports Ethernet or Wi-Fi. Confirm the final installation, enclosure, sensor, and power requirements for your machine before ordering.
Does Production Monitoring Integrate with SCADA, MES, or ERP?
Yes. The Enterprise counter supports HTTP, MQTT, and Modbus TCP for direct integration with SCADA, MES, ERP, and cloud dashboards. IoTize can also provide hosted or private dashboard deployment.
Do I Need a Subscription, and Who Owns the Data?
The counters are one-time hardware purchases. If you use the hosted platform, Cloud Starter begins at $29 per month and Cloud Pro begins at $99 per month. Enterprise private-cloud or on-premises deployment is quoted. You can export your data, and direct integration is available through open protocols.
Can One Counter Measure Quality Too?
A counter measures total units and machine state. To calculate the Quality factor of OEE, connect a good-versus-reject signal or inspection and scrap data. The sensor cannot determine product quality without that input.
How Many Machines Can I Monitor?
Start with one machine or line and scale upward. Final architecture and plan choice depend on device count, data rate, history retention, dashboard requirements, and deployment method.
What Is a Good OEE Score?
Lean Production reports about 60% as typical and 85% as world-class for discrete manufacturing. Use the benchmark as context, but focus on measuring your own baseline honestly and improving it over time.
Products: Affordable Production Counter · Enterprise Production Counter · Shop all devices
Browse by application: Production Tracking · Speed and RPM
Related solutions: Predictive Maintenance · Energy Efficiency
Platform and contact: IoT Platform · Talk to the team