

Every Machine. One Dashboard.
The IoTize IoT monitoring platform collects data from your IoTize devices, turns it into live dashboards and alerts, and keeps the full history for as long as you need it.
Run it on our cloud, or on your own servers under your own license. Your data, your way.
Real-time dashboards · Email alerts · Data export · Your data, your way
Built for the Jobs Your Factory Actually Needs
Every IoTize device streams into the same IoT monitoring platform. Start with one machine, add the rest as you grow.
Production Monitoring
Machine output, runtime, idle time and shift totals in real time.
Explore Production →Energy Monitoring
Electricity consumption per machine, per line or per facility, with full usage history.
Explore Energy →Machine Health and Predictive Maintenance
Vibration, temperature and current trends that show a failure coming before it lands.
Explore Predictive Maintenance →Smart Parking
Vehicle counts, occupancy levels and guidance signage status across your sites.
Explore Smart Parking →From Machine to Dashboard in Four Steps
- Connect the device. An IoTize device mounts on the machine and reads what matters, whether that is production counts, energy, vibration, temperature or current. No rewiring and no production stoppage.
- Stream the data. The device sends readings over Wi-Fi or Ethernet using MQTT, HTTP or Modbus TCP. No separate gateway to buy.
- Configure what you watch. Build the dashboard around your machines and set the high and low limits that matter to your process.
- Act on what you see. Watch live values from any browser, get an email the moment a threshold is crossed, and pull the history whenever you need it.
IoTize supplies the hardware. Every device in the Affordable Series, Enterprise Series and Custom Series connects to the platform out of the box, with no integration work on your side.
See Your Plant the Way You Want to See It
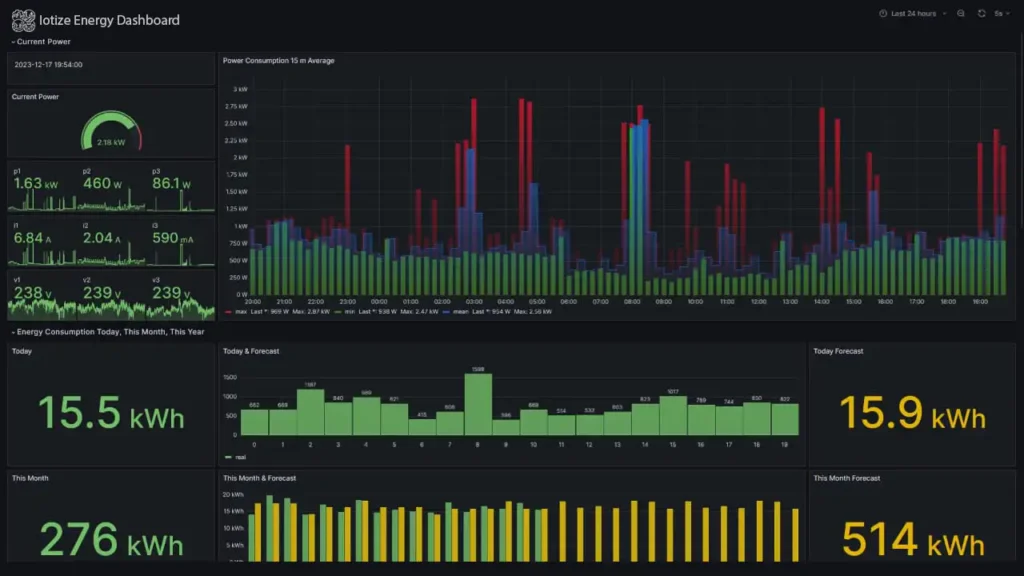
Dashboards are built around your machines, not around a fixed template. A plant manager gets the site-wide view. A maintenance lead gets vibration and temperature trends on the assets they own. An energy manager gets consumption by line. Same data, different views, one platform.
Whichever view you are in, you see live values, device connection status, historical trends and any alert that has fired, on one screen and in any browser.
Need a view that does not exist yet? Custom dashboards are part of what we build, quoted as a one-time build on top of your plan.
What the Platform Does Today
Everything listed here is live and running, not planned.
| Capability | What you get | Status |
|---|---|---|
| Device connectivity | MQTT, HTTP and Modbus TCP over Wi-Fi or Ethernet | Available |
| Live dashboards | Real-time values, gauges and device connection status | Available |
| Custom dashboards | Views built around your machines, lines and sites | Available |
| Historical data | Full time-series history with configurable retention | Available |
| Data export | Pull your own data out whenever you want it | Available |
| Threshold alerts | Configurable high and low limits with email notification | Available |
| Over-the-air updates | Remote firmware updates without a site visit | Selected devices |
| User roles and permissions | Control who sees and changes what | Available |
| Multi-machine and multi-site views | One screen across lines, plants and locations | Available |
| API access | Connect the platform to your own systems | Available |
Your Data, Your Way
Most IoT vendors keep your production data on their servers and charge you to reach it. IoTize does not work that way. The platform runs wherever your business needs it to run, and the data stays yours in every case. That is what an on-premise IoT platform should mean in practice: IoT without vendor lock-in, where you own the data and you choose where it lives.
Ready today. We host, maintain and update the platform. You log in and monitor. The fastest way to get a machine online.
Available on request for larger deployments. The platform runs in your own cloud environment under its own license, managed by your team.
Available on request for larger deployments. The platform runs on servers inside your own facility under its own license. Nothing leaves your network.
Export is always available, on every deployment. You are never locked to our servers.
Built for Real Factory Networks
Factory Wi-Fi is not perfect, and a monitoring system that loses data during an outage is not a monitoring system. Selected IoTize devices store readings locally when the connection drops and push them through once the link returns. The platform accepts those readings with their original timestamps, so your history stays complete instead of showing a gap where the outage was.
Ask us which devices include local storage for your application.
Improvements Arrive Without a Site Visit
Keeping a fleet current should not mean sending a technician to every machine. Selected IoTize devices receive firmware updates over the air, so improvements and fixes reach those devices from one place without a site visit. The platform itself is updated centrally on IoTize Cloud, which means new dashboard and alerting features arrive with no action on your side.
From Requirement to Rollout
- Share your requirement. Tell us the machines, what you need to measure, how many units and your timeline.
- We confirm the fit. We identify the right device and dashboard setup for your application and confirm what is achievable.
- Run a pilot. Start with one machine or one line. Prove the data is useful before committing further.
- Scale across the plant. Add devices as the value proves out. The platform scales from a single machine upward.
Subscription Plans
The platform is a subscription that sits alongside the one-time cost of the devices. Pick the plan that matches how you want to deploy and how far you want to scale.
Getting your first machines online fast.
Included: live dashboards, threshold email alerts, data export.
History: 6 months.
Support: email.
Discuss Your Requirement →Growing multi-machine or multi-line deployments.
Included: everything in Starter, plus user roles and permissions, API access, multi-site views.
History: 24 months.
Support: priority.
Discuss Your Requirement →Plant-wide and multi-site, or teams that must keep data in-house.
Included: everything in Pro, plus your choice of deployment and integration support.
Deployment: private cloud or on-premises, under your own license.
History: configurable, including unlimited.
Support: SLA-backed.
Request a Quote →What the base rate covers. The prices above cover standard devices: temperature sensors, production counters, single-phase energy meters and similar. Devices that stream continuously at higher data rates, such as vibration monitoring and three-phase energy monitoring, are priced above the base rate and confirmed on quote. Tell us which machines you are monitoring and we will put an exact number against it.
Custom dashboards. Every plan includes the standard dashboards for your devices. If you need views built specifically around your process, lines or sites, custom dashboard work is quoted separately as a one-time build fee on top of your subscription. You pay for it once, and it stays yours on every plan afterwards.
Billed monthly or annually. What you pay depends on how many devices you connect and of which type, how long you need the history retained, whether you need custom dashboard work and which deployment option you choose.
Questions, Answered
Yes. API access is available for connecting the platform to your own systems and workflows.
Yes. The platform is built to work with IoTize devices, which means everything is tested together and there is no integration work on your side. Every device across the Affordable, Enterprise and Custom Series connects out of the box.
Can I export my data?
Yes, on every deployment option. Your production data belongs to you and you can pull it out whenever you want.
What happens when the internet disconnects?
Selected devices store readings locally and send them once the connection returns. The platform backfills them with their original timestamps, so the history stays complete.
Do the devices update automatically?
Selected devices receive firmware updates over the air, so improvements reach them without a technician visiting each machine. The platform itself updates centrally, which means new dashboard and alerting features arrive with no action on your side. Ask us which devices support over-the-air updates for your application.
Can you build a custom dashboard for my process?
Yes. Custom dashboards are built around your machines, lines and sites rather than a fixed template. Every plan includes the standard dashboards for your devices, and bespoke views are quoted as a one-time build on top of your subscription..
Can the platform run on our own servers?
Yes, for larger deployments. As an on-premise IoT platform it can run in your own facility or private cloud, each under its own license, so your data never leaves your network. This is IoT without vendor lock-in.
How do alerts reach my team?
Configurable high and low thresholds trigger email notifications the moment a limit is crossed.
How many devices can the platform handle?
It scales from a single machine to a full plant. Start with one critical machine and add more as the value proves out.
Can I connect the platform to our existing systems?
Yes. API access is available for connecting the platform to your own systems and workflows.
What Do You Need to Monitor?
Tell us the machine, the measurement and the timeline. We will tell you which device fits and what the dashboard looks like.
Solutions: Predictive Maintenance · Energy Efficiency · Smart Parking
Products: Shop all devices
From the blog: Visit the IoTize blog →